

I’d choose the data setup before the dashboard: connect sales, landed costs, duties, and dated price changes so you can see whether higher prices protect profit – not just revenue.
I compare four approaches based on data readiness, margin reporting, and historical testing. My starting checks: confirm whether COGS already includes duties, compare profit dollars alongside margin %, and use 12–24 months of clean history to check seasonal patterns.
Quick Comparison
| Approach | Data setup | Profit reporting | Historical tests and scenarios |
|---|---|---|---|
| Retlia KPI dashboards | Retail warehouse linking sales, receipts, costs, and duties | Shared pricing and profit metrics | Dated records; scenario inputs need setup |
| Tableau within Retlia | Prepared Retlia warehouse data | Filtered views of profit dollars and margin % | Before-and-after views and duty heatmaps |
| Microsoft Power BI | Prepared warehouse data plus analyst-built models | Shared measures with role-based views | Price-volume-mix analysis and what-if models |
| Qlik Sense | Linked records across products, suppliers, and channels | Connected selections for cost and profit comparisons | Matched-period analysis; separately modeled scenarios |
My rule across all four: <u>keep recorded results separate from assumptions</u>. Check promotions, stockouts, and product mix before blaming tariffs – and confirm which views are included versus which your team must build.
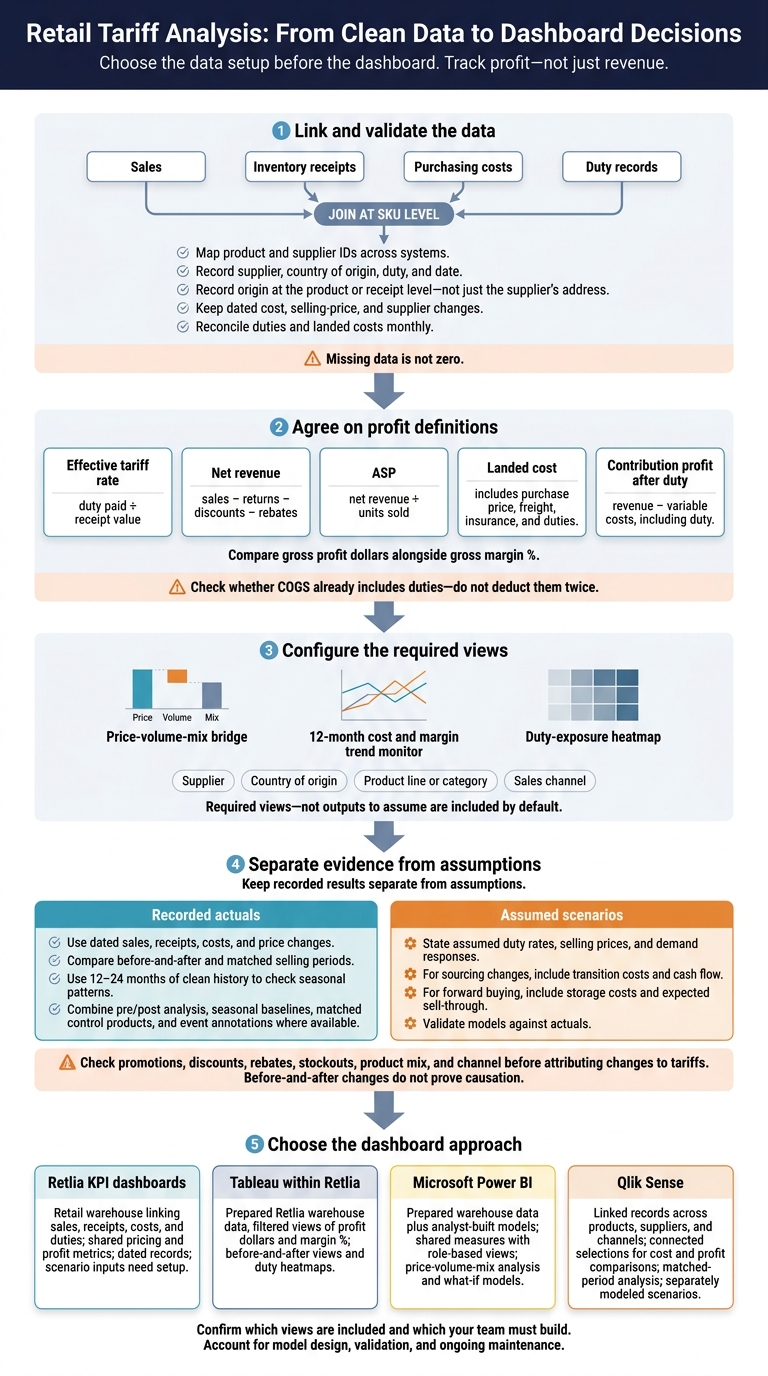
Retail Tariff Analysis: From Clean Data to Dashboard Decisions
Visualizing the Impact of Tariffs with Tableau
sbb-itb-03d92ea
1. Retlia’s Retail Data Warehouse and KPI Dashboards
Retlia brings ecommerce, POS, ERP, wholesale, and marketplace data into a retail data warehouse built for midsize teams. Its KPI dashboards bring pricing, margin, and tariff analysis together. Start by connecting source systems, mapping product and supplier IDs, and using consistent cost and profit definitions. Clean tariff data comes first.
Tariff Data Readiness
Record the supplier, country of origin, duty, and date. Link inventory receipts and sales to sourcing records, customs duty payments, and tariff schedules by date. Record country of origin at the product or receipt level – not just the supplier’s address. Map SKUs across systems, fill in missing origins, and reconcile duties monthly.[3]
Pricing and Profit Reporting
Clean tariff fields make pricing and profit reports more reliable. Define effective tariff rate as duty paid divided by receipt value.[3] Track 12-month trends in purchasing cost, COGS, selling price, and gross margin by SKU, category, and vendor.[2] Work with finance to define contribution after duty, then use the same reporting basis throughout.
Historical Testing and Scenarios
Keep dated records of price changes, supplier changes, and receipt costs so historical reports show what actually happened. Use price, volume, and mix analysis to separate higher prices from shifts in unit demand or the products customers bought.[3] Break down views by vendor, country of origin, and category to distinguish tariff effects from normal seasonal patterns.
Before forecasting a sourcing or pricing change, add updated tariff schedules, exclusions, and consumer price elasticity to the model.[3][4]
Use those historical records to choose what dashboards should show, keeping the focus on analysis rather than data cleanup.
2. Tableau Dashboards Within Retlia
Tariff Data Readiness
Once the warehouse is clean, Tableau turns tariff data into interactive views by vendor, origin, and category. These views bring prepared landed cost, duty, and margin data into focus for analysis.[3][2]
Pricing and Profit Reporting
Use filters to drill down from product line to supplier to channel. Compare profit before and after a price change, with gross profit dollars beside gross margin %.[2][3]
A higher margin percentage doesn’t necessarily mean the business earned more from those sales. Use both measures to guide pricing, sourcing, and promotion decisions.[3][4]
Historical Testing and Scenarios
Use the same filters to compare before-and-after periods side by side. Include promotions, discounts, and rebates so seasonal sales lifts aren’t mistaken for tariff effects. Price-volume-mix bridges can help separate price, volume, and mix effects from tariff-driven changes.[3]
Use a supplier-by-origin duty heatmap to spot exposure, then model the cost of sourcing shifts.[3][4]
3. Microsoft Power BI for Retail Pricing Analysis
For Microsoft-first teams, Power BI should start with prepared warehouse data – not spreadsheets. This makes it easier to compare results before and after changes by supplier, origin, product line, and channel.
Tariff Data Readiness
With clean warehouse data, Power BI can build finance-ready dashboards using SKU-level duty paid, receipt value, landed costs, and dated country-of-origin changes. IT and data engineering load tariff and ERP data into the warehouse. Analysts then build the Power BI model and price-volume-mix bridges.
Merchandising, finance, and logistics should confirm supplier changes and receipt timing so reports show when costs actually changed.[3][2][5]
Pricing and Profit Reporting
Give purchasing, merchandising, and finance one model with role-based views. Track effective tariff rate, margin, and contribution after duty together to see whether margin held after duty.[3] Reconcile landed costs monthly so missing duties don’t overstate profit.[3]
Historical Testing and Scenarios
Use the same model to separate tariff effects from normal seasonal swings. A 12-month view of cost, price, and margin helps pinpoint when margin started to decline.[2]
Keep tariff what-if assumptions separate from actual transactions. Use the model to test sourcing shifts or compare absorbing costs with passing them through to customers.[2][4][5]
4. Qlik Sense for Retail Pricing Analysis
Qlik Sense works best for teams that need to move across linked data rather than follow fixed dashboard paths. It lets them examine both past results and what’s happening now.
Tariff Data Readiness
Linked warehouse data lets teams investigate connections across supplier, origin, product, channel, and time. Keep tariff schedules, exclusion lists, and price changes dated. Review sourcing and duty data monthly with merchandising, finance, and logistics.[3][4]
Pricing and Profit Reporting
Use connected selections to compare supplier exposure, contribution after duty, margin, and channel sales. Include promotions and rebates in those comparisons.[3][4]
Teams can then move from supplier exposure to product-line impact without rebuilding the view.
Historical Testing and Scenarios
Use linked selections to compare matched selling periods. Strip out promotions, bundles, and rebates before attributing changes to tariffs. Historical selections help teams investigate results; forward-looking scenarios require assumptions about demand, cost, and lead times.[4]
For sourcing changes, include transition costs and cash flow. For forward buying, account for storage costs and expected sell-through. Keep assumptions separate from recorded results so teams don’t mistake a purchasing plan for realized savings.[4]
Tariff Data: Warehouses vs. Direct-Source Reporting
Tariff analysis needs linked records, not just linked charts. Sales, receiving costs, supplier data, and duty records must line up at the SKU level for the analysis to work.[3]
| Data requirement | Warehouse-backed dashboards | Direct-source reporting |
|---|---|---|
| Integration | Combines sales, inventory, purchasing, and external tariff records in a shared data layer. | Connects directly to live source data but often lacks external context. |
| SKU matching | Maintains shared mappings between internal SKUs, vendor item IDs, and tariff classifications. | Uses source identifiers and mappings built into the report. |
| Governance | Centralizes metric definitions, validation, and reconciliation. | Depends on source controls and consistent calculations across reports. |
| Supplier and origin | Links vendor and country-of-origin records to products and receipts. | Shows these fields only when the source records them. |
| Cost and price histories | Preserves loaded history and configured snapshots for comparison. | Uses the transaction history or snapshots the source retains. |
| Update dependencies | Depends on ingestion schedules, source availability, and dashboard refreshes. | Depends on source updates, connector limits, refresh speed, and dashboard refreshes. |
| Maintenance | Requires pipeline, mapping, and schema upkeep. | Requires connector and report upkeep, plus maintenance of any cross-source logic. |
The difference is data structure, not speed.[2][3] Retlia supports real-time and batch updates, but how current the data is still depends on each connected feed. With the data layer defined, the next step is tracking price, sales, and margin in one view.
- Agree on contribution-after-duty calculations. Check whether COGS already includes duties so you don’t deduct them twice.
- Link receipt-level duties and landed-cost adjustments to the relevant inventory and sales records.
- Keep cost and selling-price history, including effective dates for changes.
Retlia provides the warehouse, KPI dashboards, and configurable analysis layer. Tariff reporting still needs the right source fields and setup. Configure views to compare past and current margins after duty, filter exposure by supplier and country of origin, and track cost and price trends.
Each analysis also needs specific inputs. Effective tariff rates require a consistent receipt-value denominator. Price-volume-mix analysis requires matched histories and agreed rules. Sourcing scenarios require proposed costs and tariff assumptions. Configure the dashboard to show price, sales, and profit changes over time.
Tracking Prices, Sales, and Profit
Once tariff and cost data are linked, define the metrics every dashboard must report – and use the same definitions across all four approaches.
Units sold measures the total quantity sold across all channels. Net revenue is sales minus returns, discounts, and rebates. ASP is net revenue divided by units sold.[4]
Landed cost includes purchase price, freight, insurance, and duties. Gross margin must account for SKU-level landed costs in COGS. Contribution profit after duty is revenue minus variable costs, including duty.[3]
All four approaches need a price-volume-mix bridge, a 12-month cost and margin trend monitor, and a duty-exposure heatmap. Each view must share filters for supplier, country of origin, product line or category, and sales channel. These views separate tariff costs from changes in price, volume, and mix. They’re required dashboard views, not outputs to assume you’ll get by default.
| Approach | Required drilldowns | Data model needed |
|---|---|---|
| Retlia KPI dashboards | Product line or category → SKU → receipt, sale, or duty transaction detail | Unified sales, purchasing, receipt, landed-cost, and tariff data |
| Tableau dashboards within Retlia | Product category → SKU → receipt, sale, or duty transaction detail | Retlia warehouse data with matched product histories and consistent bridge calculations |
| Microsoft Power BI for retail pricing analysis | Category → SKU → transaction, receipt, or duty transaction detail | Related sales and receipt records with shared dimensions and calculated measures |
| Qlik Sense for retail pricing analysis | Product group → SKU → receipt, sale, or duty transaction detail | Consistent product keys linking sales, purchasing, duty, and promotion records |
With these views in place, compare historical results before and after pricing or sourcing changes. Mark price changes, supplier changes, and promotion dates. Then filter by product line to see how results shifted.
| Business question | What to examine | Practical decision check |
|---|---|---|
| Did price increases preserve profit? | ASP, units, total contribution profit, and a price-volume-mix bridge | Check whether higher profit per unit offsets lower volume. Separate price and mix effects from cost changes. |
| Which suppliers drive margin losses? | Unit landed cost versus ASP over a 12-month trend, filtered by supplier and country of origin | Find products whose costs rise faster than selling prices. Separate supplier price increases from added duties. |
| Are discounts still profitable? | Promotion-level net revenue, units, and contribution profit after duty | Judge incremental contribution, not sales lift alone. Include returns and rebates before deciding to repeat the offer. |
Charts can’t fix missing origin records, duty classifications, or cost allocations.[3] Flag incomplete records in the dashboard so the historical tests that follow don’t treat missing data as zero.
Historical Tests, Scenarios, and Dashboard Selection
Before-and-after changes can point to an impact, but they don’t prove causation. Use these methods to separate tariff effects from seasonality, promotions, and stockouts.
| Method | Strength | Limitation | Setup trade-off |
|---|---|---|---|
| Pre/post analysis | Shows immediate shifts around a pricing or tariff event. | Promotions and market changes can distort results. | Low effort; needs event dates and comparable periods. [1][2] |
| Seasonal baseline | Separates normal demand cycles from tariff effects. | Product changes can weaken comparisons. | Needs 12–24 months of clean history. [2] |
| Matched control products | Supports comparisons with products unaffected by tariffs. | Differences in demand or availability can bias results. | Needs product attributes and verified tariff exposure. [1] |
| Event annotations | Connects shifts to tariff, exclusion, or supplier-origin events. | Does not establish causation. | Needs reliable event updates. [3] |
| Scenario modeling | Tests pricing and sourcing decisions before you put them into practice. | Results depend on demand and cost assumptions. | Needs explicit inputs, model upkeep, and validation against actuals. [4] |
Use the strongest combination available – not just one test – before naming a tariff as the cause.
Keep actuals and scenarios separate. Actuals show recorded sales and costs. Scenarios spell out assumed duty rates, selling prices, and demand responses. Compare results within the same promotion status, inventory availability, product mix, and channel. Stockouts can hold sales down, so read changes carefully when availability shifts. [2][3][4]
Apply that same rule when choosing a dashboard: favor a setup that separates actuals, assumptions, and scenario outputs.
For midsize teams, prioritize a warehouse-first setup when clean history and standardized KPIs matter most. During onboarding, confirm which tariff views come preconfigured and which scenario calculations need more modeling. [3][4]
Choose a build-your-own stack only if your team can handle model design, validation, and regular maintenance. Compare that recurring modeling work with the cost of maintaining the warehouse and reporting layer. [5]
FAQs
How do I allocate duties across inventory sold at different times?
Bring inventory receipts, duty schedules, and sales data into one data warehouse. Record each SKU’s landed cost and effective tariff rate – duty paid divided by receipt value – to track cost changes.
Use this data to assign recurring duty costs to the specific inventory sold and track margins by SKU. Including duty costs helps you avoid pricing decisions based on incomplete cost figures.
How can I estimate demand before raising prices?
Use historical sales data to compare units sold at different prices. This helps estimate price elasticity, or how demand changes when prices change.
Track units sold, gross margins, and pass-through rates in your data warehouse. Before committing to a price increase, model what happens if sales volumes drop.
Break down the data by brand, category, and customer type to spot price-sensitive products. These products may need smaller pack sizes or changes in sourcing rather than higher prices.
How quickly can Retlia dashboards reveal tariff impacts?
Retlia dashboards show tariff impacts in real time, so teams don’t have to wait for manual spreadsheet reports after month-end. Retlia brings landed cost, duties, sales volume, and margin data into one data warehouse, letting teams track tariff exposure and test pricing scenarios right away.
Merchandising, finance, and sourcing teams can spot shrinking margins and use that data to guide repricing or sourcing decisions as market conditions change.
