

Tariffs can cut margin before your team updates a single price. In one KPMG survey, about 50% of U.S. retailers said tariff-driven cost increases reduced gross margin by 1 to 5 percentage points.
If I had to sum up the fix in one line, it would be this: I need SKU-level cost, price, vendor, and channel data in one place so I can see which items to reprice, cut, shift, or move first.
Here’s the short version:
- Tariffs hit landed cost first, while pricing and promo changes often lag
- Monthly reports come too late when margin is slipping mid-month
- Category averages hide the problem because tariff pain usually sits in a small set of SKUs
- The main moves are simple: reprice, re-assort, re-source, and reallocate inventory
- The data has to connect across ERP, POS, ecommerce, marketplaces, vendor files, and product records
- The key views are SKU, vendor, country of origin, and channel
- The goal is to protect gross margin with faster item-level decisions
A few metrics matter most:
| Metric | What I use it for |
|---|---|
| Post-tariff landed cost | Set a new price floor |
| Gross margin change | Spot margin pressure fast |
| Pass-through rate | See whether price is keeping up with cost |
| Units sold after price change | Check demand after repricing |
| Vendor and origin exposure | Find sourcing risk |
The article boils down to a plain idea: when tariff costs, sales, and supplier data stay split across systems, I’m late. When they’re unified, I can act with much better precision.
That’s what this piece covers, along with how Retlia helps midsize retail teams do it without a heavy IT project.
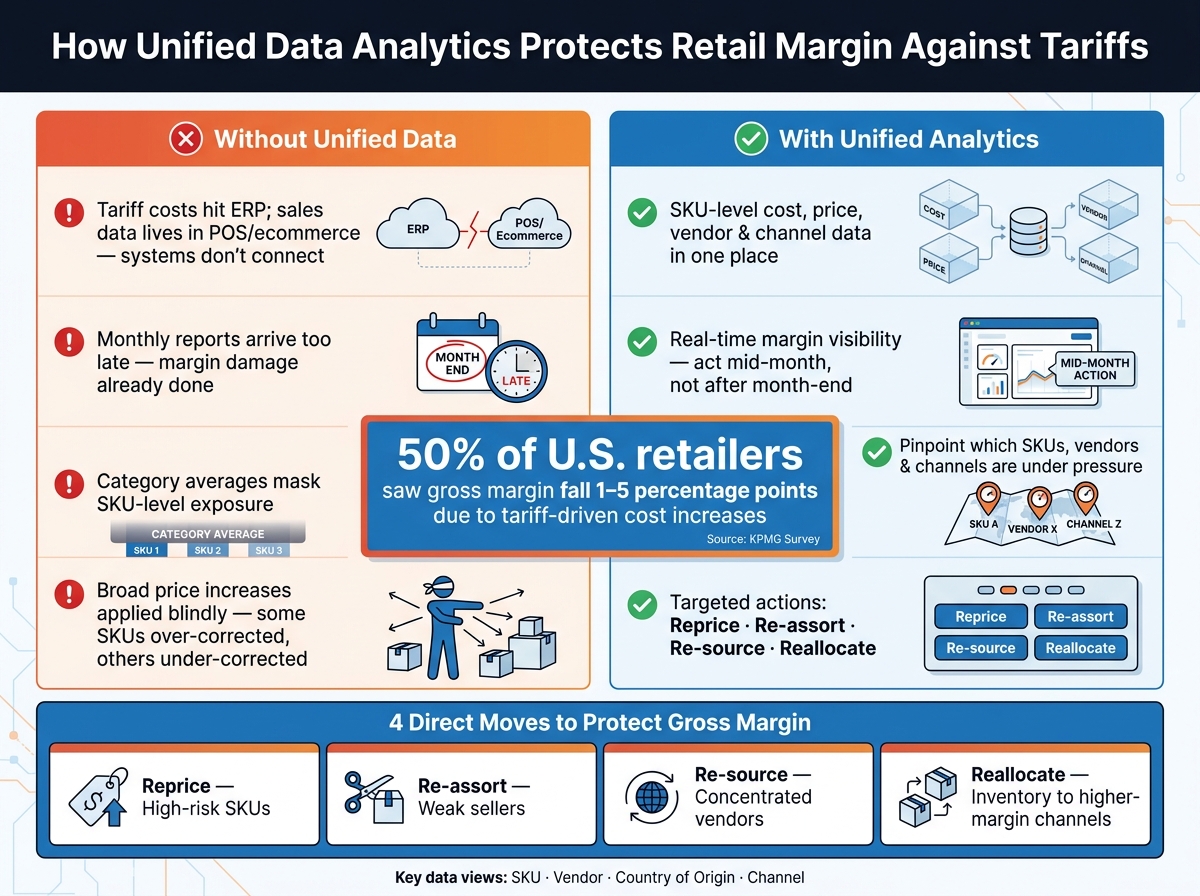
Tariff Impact: Fragmented Data vs. Unified Analytics for Retail Margin Protection
How Tariffs and Inflation Are Shaping the Retail Economy
sbb-itb-03d92ea
Tariffs hit margin before they hit pricing
Tariffs push up landed cost right away. Pricing and promo changes don’t. That gap eats into margin before teams have time to respond.
The hard part isn’t just the cost increase itself. It’s that teams can see the higher cost before they can see the item-level damage.
A KPMG survey found that about 50% of U.S. retailers saw gross margins fall by 1 to 5 percentage points due to tariff-driven cost increases [1]. And that hit shows up before pricing systems catch up – and before most teams can tell which SKUs are exposed.
Where midsize retail teams lose visibility
In many retail stacks, tariff costs show up in the ERP or purchasing system, while sales data lives somewhere else: POS, ecommerce platforms, and marketplace feeds.
That’s where things start to break.
These systems often don’t use the same item IDs. One may track products by UPC, while another uses an internal item code. So when tariffs push up landed cost for a vendor’s products, the ERP reflects that change. But if the data join relies on mismatched codes, teams miss the connection. A channel report may still show profit even while the ERP is already showing margin slippage.
Manual spreadsheet joins make the problem worse. If cost files aren’t refreshed mid-month, a tariff increase applied to purchase orders in week two may not show up in performance reporting until long after month-end. By then, the damage is already done.
Without one item view across systems, teams can’t clearly see which SKUs, vendors, or channels are under margin pressure.
What decisions suffer without unified analytics
When visibility is weak, teams often fall back on blunt moves like broad category price increases. But that can miss the mark in both directions. Some items get marked up even though margins are still fine, while the SKUs hit hardest by tariffs don’t get enough correction.
Promotions and markdowns can also keep running as if nothing changed. That means items that are now below target margin stay on discount, which adds even more pressure.
Sourcing decisions take a hit too. Without vendor-level margin data tied to tariff exposure, buyers may keep sending volume to suppliers whose products are no longer as profitable. Assortment decisions slow down for the same reason. Items that have quietly slipped below target margin thresholds stay in the mix because the signal arrives too late, buried in a lagging monthly report.
That’s why tariff impact dashboards need visibility at the SKU, vendor, and channel level.
Analytics workflows that reduce tariff impact
Move fast enough to protect margin. The simplest way to do that is to connect cost, sales, vendor, and channel data in one shared view so merchants, finance, and supply chain teams can act without living in spreadsheets.
Tariff impact dashboards for SKU, channel, and vendor risk
Once teams have one view of the data, the next job is turning tariff exposure into specific pricing and sourcing actions.
A tariff impact dashboard should bring landed cost, duties, sales volume, discounting, and gross margin into one place. It should also let teams filter by brand, category, origin, vendor, and channel.
Focus first on the metrics that point to action: margin losers, pass-through rate, and SKUs below target margin. Those are the numbers that help teams decide what to reprice, what to trim from the assortment, and where supplier changes may make sense.[7][2]
| Metric | What it shows | Decision it supports |
|---|---|---|
| Post-tariff landed cost per unit | New all-in cost after tariffs, freight, and brokerage | Set new price floors and margin targets per SKU |
| Duty amount as % of cost | Share of total cost driven by tariffs | Prioritize sourcing changes for highest-exposure SKUs |
| Gross margin change vs. last quarter | Margin erosion at SKU and brand level | Identify what to reprice, cut, or bundle |
| Pass-through rate | How much cost increase is reflected in retail price | Decide where to raise prices vs. absorb margin |
| Units sold trend after price change | Demand response to recent price moves | Refine elasticity assumptions and promo strategy |
When these numbers sit side by side, weak spots show up fast. A SKU with a big jump in landed cost, a low pass-through rate, and falling margin is usually telling you the same thing from three angles: something has to change.
SKU and vendor analysis to find what to reprice, cut, or shift
That dashboard should lead straight to item-level decisions.
Item-level profitability analysis helps teams sort SKUs into clear action groups: items that can take a price increase, items that need a lower-cost substitute, and items that should be removed from low-performing channels. To get an honest margin view, include tariffs, freight, fulfillment, platform fees, ads, returns, and markdowns.[4][5][8]
Vendor concentration and country-of-origin analysis add one more layer. If 60% to 70% or more of tariff-affected costs come from one country or one supplier, that should be flagged as sourcing concentration risk.[3][6] Looking at vendor, origin, tariff rate, and projected margin side by side makes it much easier to spot suppliers with the most exposure.
| Vendor | Country of Origin | Avg. Tariff Rate | Landed Cost/Unit (USD) | On-Time Rate | Projected Margin (%) |
|---|---|---|---|---|---|
| Vendor A | China | 15% | $4.20 | 92% | 28% |
| Vendor B | Vietnam | 5% | $3.80 | 88% | 33% |
| Vendor C | Mexico | 0% | $4.00 | 96% | 31% |
A table like this makes the tradeoffs easy to see. High tariffs paired with weaker reliability are hard to ignore. On the other hand, a supplier with a lower tariff rate and better margin may be worth more volume, even if the unit cost is not the absolute lowest.
Elasticity and sourcing scenarios for smarter next moves
Not every tariff-hit SKU should get a price increase. Historical price and demand data can show which items hold volume after a price move and which ones fall off. That split shapes the next step: raise price, reduce pack size, switch to a substitute, or change sourcing.[9][10]
Sourcing scenario comparisons push this one step further. Teams can model what happens if volume moves to a different supplier or origin country, then compare tariff rate, landed cost, lead time, on-time rate, and projected margin before making the shift.[8][10]
| Scenario | Country Mix | Avg. Tariff Rate | Landed Cost/Unit (USD) | Lead Time | On-Time Rate | Projected Gross Margin |
|---|---|---|---|---|---|---|
| Current sourcing | Mostly China | Higher tariff burden | Higher landed cost | Shorter | Stronger | Lower |
| Partial shift | Mixed China / Vietnam | Moderate tariff burden | Slightly lower landed cost | Slightly longer | Slightly lower | Higher |
| Full shift | Mostly Vietnam | Lower tariff burden | Lowest landed cost | Longer | Lower | Highest |
This kind of side-by-side view keeps teams from guessing. For example, a company might accept up to five extra days of lead time if gross margin improves by at least 3 percentage points. That turns a messy sourcing debate into a clear operating rule.[8][10]
These workflows move fastest when the data is already unified in a retail warehouse and dashboard layer.
How Retlia helps midsize teams act without heavy IT lift
Tariff workflows only work when cost, sales, and vendor data live in one warehouse. For many midsize retail teams, that data is spread across core retail systems and spreadsheets. Pulling it together often means waiting on IT or paying for a custom setup.
Retlia gives midsize teams a tariff-ready warehouse without that buildout. It’s a retail data warehouse and BI platform made for midsize commerce businesses, with schemas, pipelines, and retail KPI models already set up. Implementation usually takes about 60 days and needs only a light internal lift: a business sponsor, one or two IT contacts to grant system access, and key end users who can spell out what the dashboards need to answer.
What data Retlia unifies for tariff analysis
For tariff analysis, Retlia connects and standardizes the data sets that matter most:
- Product master data, including SKU attributes and country of origin
- Vendor and supplier records
- Purchasing and PO data
- Landed cost and freight
- Sales and returns by channel
- Channel performance across ecommerce, wholesale, marketplaces, and brick-and-mortar POS
Retlia models these data sets together so each SKU can be tracked from source to tariff impact to channel margin.[11][12][14] It also reconciles item and vendor IDs and flags missing origin or cost data before that data shows up in a dashboard. That base supports the dashboards that turn tariff exposure into pricing and sourcing moves.
What decisions Retlia dashboards support
Retlia’s pre-built retail KPI dashboards show tariff impact by SKU, vendor, category, channel, and country of origin. A pricing analyst can group SKUs by margin band and tariff intensity, then test a price change to see projected margin impact in USD – without SQL.[13] A sourcing manager can filter by country of origin, spot which vendors carry the most margin risk, and model a volume shift to a lower-tariff supplier before making a call.
Retlia is usually priced at $1,000 to $3,000 per month, including the warehouse, BI tools, and managed pipelines. Once the data layer is in place, teams can move faster on pricing, sourcing, and assortment changes.
Use data to respond to tariffs faster and with less margin damage
Tariff damage usually isn’t spread evenly across the business. In most cases, a small group of SKUs – often tied to just a few vendors and product categories – drives most of the margin hit. If your data lives in separate systems, that pattern is hard to spot in time.
That’s the problem with fragmented reporting. Tariff-related margin loss stays buried until teams manually piece together ERP data, pricing data, and vendor records. By the time the picture is clear, you’ve already lost time.
When the data is unified, the response gets much more precise. Teams can stop reacting in broad strokes and focus on four direct moves:
- Reprice high-risk SKUs
- Re-assort weak sellers
- Re-source concentrated vendors
- Reallocate inventory to channels with better margins
This is where a retail data warehouse moves from reporting to action.
Retlia pulls landed cost, country of origin, vendor records, and channel sales into one warehouse. Then it surfaces that data in dashboards that merchandising, finance, and sourcing teams can use right away – supporting the same repricing, re-assorting, re-sourcing, and inventory reallocation decisions covered throughout this article.
FAQs
Which SKUs should I review first after a tariff change?
Start with a ranked exception list of high-risk SKUs and suppliers.
Put the most urgent cases at the top:
- Items with the sharpest margin erosion
- Vendor cost increases above 3% in the last 30 days without a matching price change
- Major supply chain or lead time disruptions
Then use your data warehouse to bucket SKUs so you can make cleaner calls on what to do next. The goal is simple: protect margins where you can, pass through cost increases where it makes sense, and adjust assortments based on real-time profitability and performance data.
How often should tariff impact data be updated?
Tariff data needs to stay live so retailers can keep a close eye on margins, inventory, and supplier costs as conditions change. When pricing shifts or the market moves, stale data can leave teams reacting too late.
Monthly reviews can still make sense for big-picture KPIs. But for day-to-day tariff and inventory decisions, the data should update in real time through a data warehouse and connected dashboards.
What data do I need for a tariff dashboard?
To build an effective tariff dashboard, pull fragmented data into a central retail data warehouse that ties costs to each product, channel, and supplier.
Start with your POS and ERP data. Then layer in e-commerce, inventory, and marketing feeds. Key inputs include supplier cost updates, landed costs, transportation expenses, SKU-level sales velocity, returns, and inventory levels, all standardized by currency and date.
