

If your POS, ecommerce, and ERP all show different numbers, the fix starts with a shared data schema. For midsize U.S. retailers, the main problem is not lack of data. It is disconnected systems, manual spreadsheet work, and small IT teams that cannot keep up with reporting requests.
Here’s the short version:
- 61% of retail organizations say data usability is a top issue
- 48% struggle with data integration
- Teams spend about 45% of analytics time on data prep
- Data prep often takes about a week before analysis can even start
- Retlia offers a retail schema, data warehouse, integrations, dashboards, and setup in about 60 days
- Pricing starts around $1,000 to $3,000 per month
What this means for me is simple: when products, customers, stores, orders, returns, inventory, and promotions all follow the same data structure, reporting gets easier, dashboards are more consistent, and teams spend less time arguing over numbers.
In plain English: this article explains common retail data problems and their solutions, why schema design matters, what Retlia includes, and how that setup can cut manual work and help teams get reports out in less time.
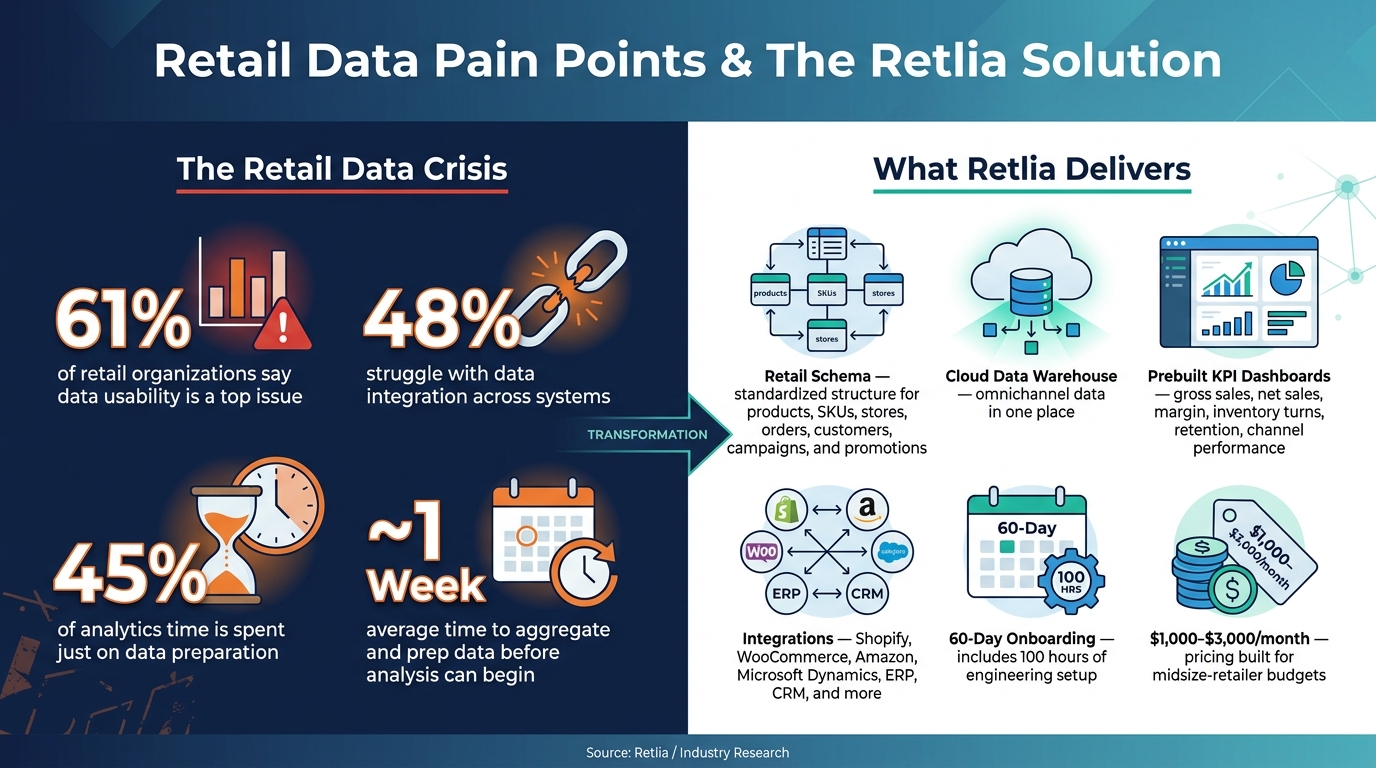
Retail Data Pain Points & The Retlia Solution at a Glance
Fragmented retail data slows reporting and decision-making
Midsize retailers don’t have a shortage of data. They have a consistency problem.
POS, ecommerce, ERP, CRM, loyalty, and marketing platforms each keep their own version of the truth. Those systems store data on their own, and the numbers often don’t line up. The first place that shows up is in reporting.
Separate systems produce different versions of the same data
When each platform defines core metrics differently, conflicting numbers are almost guaranteed. An ERP may calculate net sales as gross sales minus discounts. An ecommerce platform may also subtract returns and taxes. A POS system may record a return on the day it happens at the register, while an online platform ties that return to the original order date. So now you have different answers for sales, margin, returns, and channel performance.[2][5]
The same thing happens with product and customer data. One SKU can have different IDs in your POS, online store, and marketplace account. A shopper who buys in-store and online can show up as two separate records. Without a shared structure across those systems, margin, return rates, and channel performance stop being numbers people can trust. Then every business review turns into a debate over whose report is right instead of what action to take.[2][5]
Manual spreadsheet reporting wastes time and introduces errors
When systems don’t connect, people fill the gap by hand. That usually means exporting CSV files from each platform, cleaning them up in Excel, and stitching them together with lookup formulas that break the moment a product category changes or a new store opens.
Research shows that about 45% of time on data analytics projects goes toward data preparation alone, and it takes roughly a week on average to aggregate and prepare data before it’s ready for analysis.[1]
By the time the report lands in someone’s inbox, it’s already out of date.[4] And manual work comes with manual mistakes: mismatched columns, overwritten formulas, stale totals. After a while, leaders stop trusting centralized reports and start asking for screenshots from source systems instead. When reporting depends on cleanup work, every new request slows the next one.
Small IT teams leave business users waiting for answers
Most midsize retailers don’t have a dedicated data engineering team. IT is already stretched thin across POS uptime, ecommerce stability, and store infrastructure. So when merchandising asks for a new sell-through dashboard, or finance needs margin broken out by channel, those requests can sit in a queue for weeks.[3][5]
The result is slower decision-making across the business. Promotions stay live longer than they should. Markdowns happen too late. Pricing calls get made on gut feel because the data isn’t ready when people need it. Analysts end up spending their time moving and cleaning data instead of doing the analysis that can help the business grow.[6]
The fix starts with a retail schema that standardizes these records before reporting begins.
sbb-itb-03d92ea
Why a retail-specific schema is the right starting point
The issue starts long before reporting. It starts with how retail data is set up in the first place. A retail-specific schema fixes that at the source.
That’s why the schema matters before a dashboard ever shows up.
A schema gives products, stores, customers, and transactions a single consistent structure
A data schema is the blueprint for how retail data is named and linked. A sale in a store and an online order follow the same structure, so POS, ecommerce, inventory, and customer records line up.
With that setup, the same transaction gets counted once, in the same way, across channels.
There’s another upside too: speed. Much of the structure is already there.
Prebuilt retail entities cut setup time for midsize teams
A retail-specific schema comes with the core building blocks already defined: products, SKUs, stores, channels, transactions, customers, campaigns, promotions, and inventory levels – plus the relationships between them.
That means less time spent modeling data from scratch. Teams can put more of their energy into connecting sources and answering business questions.
Shared definitions build trust in dashboards and analysis
Even a retail KPI dashboard falls apart if the definitions underneath it don’t match. If merchandising defines net sales one way and finance defines it another, people stop trusting the number. Then every executive review turns into an argument instead of a decision.
A retail-specific schema fixes that by standardizing the definitions that matter most: revenue, margin, returns, inventory, and customer value. Shared metric definitions and steady identifiers keep every team working from the same calculation. That’s what makes reporting reliable enough to use.
That foundation is what Retlia packages into a retail data warehouse built for midsize teams.
What Retlia includes for midsize retailers

Retlia puts the main pieces in one package: a retail schema, cloud warehouse, dashboards, integrations, and onboarding. For midsize retail teams, that means getting to usable data faster without kicking off a big IT project.
Prebuilt retail schema and warehouse for omnichannel data
Retlia’s warehouse is built around the retail entities teams use every day: products, brands, categories, SKUs, stores, channels, orders, returns, customers, households, campaigns, and promotions.
That setup matters because it helps unify multiple data sources for consistent reporting. A Shopify order and a POS sale land in the same order model, with the same definitions for units, sales, discounts, and margin. So instead of arguing over whose number is “right,” teams can work from the same source.
Retlia also handles identity matching. If your POS uses one SKU format and your ERP uses another, Retlia maps both to a single product record. If a shopper uses one email in-store and another online, Retlia links those records into one customer profile and can group them into household views.
Dashboards, self-service analytics, and 360° customer analysis
Once the warehouse is in place, Retlia’s prebuilt KPI dashboards track the numbers retail teams watch most:
- Gross sales
- Net sales
- Margin
- Inventory turns
- Retention
- Channel performance
Because everything sits on the same schema, a merchandising manager can slice results by channel, region, or product category without sending a ticket to IT.
Retlia also includes a self-service analytics tool, so business users can build reports without SQL. In practice, that means teams can look at purchase history, channel preference, and campaign response in one view instead of pulling data from a bunch of separate tools.
Integrations, onboarding, and pricing built for midsize-retailer budgets
Retlia connects to systems many midsize U.S. retailers already use, including Shopify, WooCommerce, Amazon, Microsoft Dynamics, and other ERP, CRM, inventory, and marketing tools. Connections can run through API, file, or database methods.
Onboarding runs as a 60-day implementation. Retlia’s team handles data setup and dashboard build, which helps your IT staff stay focused on day-to-day operations. The base package includes 100 hours of engineering setup, ongoing support, and warehouse and BI licenses, priced at $1,000 to $3,000 per month to fit midsize-retailer budgets and cut software and maintenance costs.
The result is pretty simple: faster reporting, cleaner dashboards, and better day-to-day decisions.
How a tailored schema improves reporting, dashboards, and decisions
Faster reporting with fewer manual steps
Once the schema is set up, reporting gets faster right away. When POS, ecommerce, and inventory data flow into one warehouse, weekly reporting can run automatically. That means reports are ready for Monday review without the usual spreadsheet cleanup.
The time savings can be dramatic. Schema-driven warehouses have cut report generation from days to minutes, and daily sales reports from 45+ minutes to about 3 minutes.[7][8][9]
Because products, stores, transactions, customers, and campaigns all sit inside one model, reporting uses the same structure every time. That removes a lot of the back-and-forth that slows teams down. Promotion analysis also becomes much easier. Since campaign IDs and discounts stay linked to each transaction, your team can measure incremental revenue and ROI without rebuilding a custom report from scratch every time.
Cleaner dashboards for merchandising, marketing, and executive teams
That same structure flows straight into dashboards. Every dashboard uses the same definitions for sales, margin, and active customers. So merchandising, marketing, and finance are all looking at the same numbers.
That kind of consistency matters more than people think. Instead of spending time reconciling reports, teams can get to the point faster and talk about what the numbers mean.
Better decisions without relying on technical specialists
A retail-specific schema also makes day-to-day decision-making less dependent on technical specialists. Merchandisers can spot product and category shifts much sooner. Marketers can see which campaigns drive incremental revenue. Executives can drill into sales and margin without waiting on SQL pulls.
Leadership can also dig into stores, categories, or regions on their own, without stopping to ask an analyst for help.
A purpose-built retail schema speeds time to value
Once the schema is live, the payoff shows up fast: reports run sooner, and teams start using them sooner. With a retail-specific schema in place, midsize retailers get trusted reporting faster because core data flows into one shared model.
That shared structure removes the biggest roadblock to faster analytics. The schema is what makes reporting move faster. It’s not just a back-end framework. It’s the base that lets POS, ecommerce, inventory, and customer data work together without manual cleanup between steps.
That’s the base Retlia brings together in one platform. Retlia combines the schema, warehouse, integrations, dashboards, and onboarding midsize retailers need to get to trusted reports fast – at a much lower cost than hiring data engineers or piecing together separate tools and consultants to build a custom model from scratch.
Retailers can often go from setup to trusted dashboards in a few weeks. After that, they can use the same reports across merchandising, marketing, and leadership. The result is faster reporting, cleaner dashboards, and less reliance on IT.
For midsize retailers, the fastest path to trusted analytics starts with a schema built for retail from day one.
FAQs
How does a retail schema reduce reporting errors?
A retail schema cuts reporting errors by bringing POS, eCommerce, inventory, promotions, and customer data into one governed reporting layer. That means teams work from the same names, the same cleanup logic, and the same business rules instead of stitching things together in different ways.
It also helps at the data-model level. When data is organized in a normalized 3NF warehouse, and preset calculations are built into the model, you get fewer bad joins and fewer metric mismatches. On top of that, automated validation and consistency checks flag problems before anyone builds reports or dashboards on top of them.
What data sources can be unified in one retail warehouse?
A single retail warehouse can bring data from several key systems into one place:
- POS systems
- Inventory management/WMS
- E-commerce platforms
- ERP, CRM, and promotions/marketing
- Marketplace feeds and ad platforms, when applicable
That means one place for transactions, stock levels, orders, returns, customer profiles, purchase history, shipments, vendor orders, and promotion performance.
How much IT involvement is needed to get started?
You can get started with very little IT help. Retlia plugs into your current POS, ecommerce, inventory, promotions, and customer systems through prebuilt integrations, so you usually won’t need heavy coding.
Setup usually takes about 60 days. That includes 100 hours of hands-on data engineering plus training for your team. After that, most teams spend only about 10 hours per month on maintenance, schema updates, and support.