

I start tariff planning with profit by SKU – not the duty bill alone. In the article’s example, a duty increase from 10% to 25% cuts projected gross profit by $6,000 across 2,000 units if prices and sales stay unchanged.
To decide what to do, I connect tariff, supplier, inventory, cost, and sales records, then:
- Calculate landed costs and margins, keeping older inventory costs separate from future receipt costs.
- Rank products by projected profit loss, with checks for uncertain rates and missing data.
- Compare pricing, suppliers, and purchase timing, including demand changes, order minimums, and cash needs.
- Set up reporting in Retlia, assign data owners, and track actual profit, inventory, cash, and reporting time.
My rule: <u>compare total profit, not just margin per unit</u>. A higher price or lower supplier quote only helps if the numbers still work after sales changes, fees, and inventory costs.
Tariff accounting & retail margins: Here’s what to know
sbb-itb-03d92ea
Connect Tariff, Supplier, and Sales Data
Bring ERP product and supplier masters, purchase orders and receipts, inventory balances, POS and e-commerce sales and returns, and marketplace orders and fees into one warehouse. Connect the records with stable internal SKU and supplier IDs.
Keep sales detail by channel so finance can compare landed costs with actual selling prices without joining spreadsheets by hand. These links provide the cost base for SKU-level margin analysis by channel.
Link Tariff Rates to SKUs and Suppliers
Build a date-effective tariff table that links each SKU, supplier, HTSUS classification, and country of origin to the applicable rate. Include the source document, validation date, and confidence status. Match each purchase-order line to the tariff record valid on the relevant import or entry date.
Store general duties, special-program rates, and additional Chapter 99 rates separately. Country of origin and trade-program eligibility can change which rate applies. Keep confirmed, proposed, and scenario rates separate, and check them against current HTSUS and CBP guidance.[3][4][5]
Calculate Landed Cost with Tariffs
Calculate per-unit landed cost by adding purchase cost, allocated freight, insurance, brokerage, duties, and other import charges. For a simple ad valorem duty, multiply the dutiable value per unit by the applicable rate, then add the duty to the other cost components. Use dutiable value – not retail price – as the duty basis.
Document how you allocate freight and fees, along with the customs value definition used to calculate duties. This lets teams reconcile costs to customs records. Model percentage, per-unit, and compound duty charges separately rather than treating every charge as a percentage.[1][2][6][7] Finance can then compare a clear per-unit cost against the actual selling price.
Clean and Standardize Warehouse Records
In Retlia’s data warehouse, standardize product and supplier records to resolve duplicate names, inconsistent SKU mappings, missing origins, and pack-size differences. This keeps margin scenarios tied to one cost definition.
Assign owners and review dates to imported SKUs. Send uncertain classifications to a trade-compliance specialist instead of estimating a rate. Convert purchase quantities into sellable units before calculating unit costs.
For currency conversions, retain the original amount, currency, exchange rate, and conversion date. Keep accounting rates separate from forecast assumptions.
Flag missing classifications, invalid conversion factors, negative unit costs, and large cost changes for review. Reconcile purchase totals to ERP invoices, duties to customs entries or broker statements, inventory to warehouse records, and sales to channel reports. Preserve timestamps and historical versions so teams can reproduce earlier margin estimates and calculate tariff-adjusted landed cost at the SKU level.
Measure Tariff Exposure by SKU
Once you’ve defined landed cost, measure where tariff changes will affect margins next.
Keep two cost views in the exposure report: existing inventory at booked cost and future receipts at replacement cost. Booked cost preserves historical margin, while replacement cost shows exposure on future sales.
Calculate Margins Before and After Tariff Changes
Calculate unit gross profit = net selling price − landed unit cost, then gross margin = unit gross profit ÷ net selling price. Use selling prices after discounts, returns, and allowances – not list prices.[8] Measure margin changes in percentage points.
Rank Margin Risk by Product and Channel
Rank SKU/channel records by projected gross profit loss in dollars first. Then flag steep margin declines, high sales volume, single-source suppliers, and near-term replenishment.
Calculate forecast-period margin impact = (scenario unit gross profit − baseline unit gross profit) × forecast units. Keep channel fees and fulfillment costs in view: a healthy gross margin can still mask weak channel profitability.
Use these scenario results as inputs to the SKU/channel priority list.
Illustrative replacement-cost scenario – not actual tariff rates or booked results: For October 1–December 31, 2026, assume 2,000 units sell from future receipts subject to each modeled rate. Assume a $20.00 dutiable value, $5.00 in other landed costs, and a $50.00 net selling price. Hold freight, exchange rates, and sales volume constant. Current-rate matches baseline because no rate change occurs.
Case Duty rate Landed unit cost Net selling price Unit gross profit Gross margin Forecast units Forecast-period margin impact vs. baseline Baseline 10% $27.00 $50.00 $23.00 46.0% 2,000 $0 Current-rate 10% $27.00 $50.00 $23.00 46.0% 2,000 $0 Proposed-rate 25% $30.00 $50.00 $20.00 40.0% 2,000 −$6,000
For a mixed-inventory forecast, apply replacement cost only to units sold from affected receipts. Keep booked cost for older stock.
Add expected depletion dates, supplier concentration, and data-confidence flags to the ranked report. Review high-dollar exposure and uncertain inputs before changing prices or orders. Use the ranked exposure list to test pricing, sourcing, and purchase timing responses.
Compare Pricing, Sourcing, and Purchasing Options
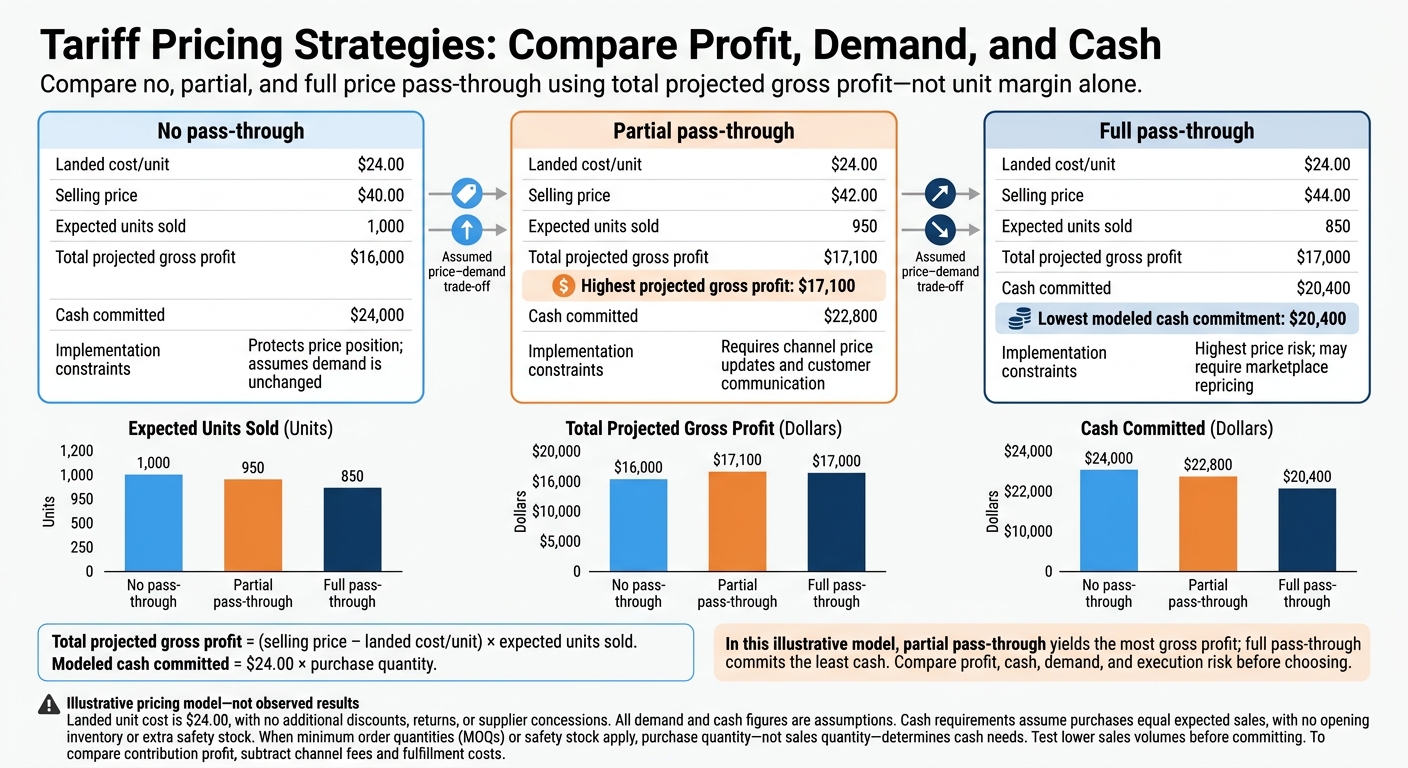
Tariff Pricing Strategies: Compare Profit, Demand, and Cash
Run all three tests using the same SKU, supplier, tariff, and sales records already loaded in the warehouse. Start with the highest-risk SKUs in the exposure report to compare pricing, sourcing, and purchase timing.
Test Full, Partial, and No Price Pass-Through
Model each SKU/channel separately using sales history. Separate regular-price demand from promotional demand, then test base, upside, and downside sales volumes.
Illustrative pricing model – not observed results: Assume a $24.00 landed unit cost and no additional discounts, returns, or supplier concessions. Cash requirements assume purchases equal expected sales, with no opening inventory or extra safety stock.
Response Landed cost/unit Selling price Expected units sold Total projected gross profit Cash committed Implementation constraints No pass-through $24.00 $40.00 1,000 $16,000 $24,000 Protects price position; assumes demand is unchanged Partial pass-through $24.00 $42.00 950 $17,100 $22,800 Requires channel price updates and customer communication Full pass-through $24.00 $44.00 850 $17,000 $20,400 Highest price risk; may require marketplace repricing
All demand and cash figures are assumptions. When minimum order quantities (MOQs) or safety stock apply, purchase quantity – not sales quantity – determines cash needs.
Test lower sales volumes before committing. Choose the option that protects total projected gross profit with the least cash and execution risk. To compare contribution profit, subtract channel fees and fulfillment costs.
Compare Supplier Landed Costs and Terms
If you can’t pass much of the cost increase to customers, compare landed costs across suppliers next.
Request quotes that include origin documentation, HTS classification support, Incoterms, freight basis, minimum order quantity (MOQ), lead time, payment terms, and expiration dates. Shipping location does not prove origin. Verify where the goods were manufactured, produced, or grown. [9] Seek customs advice if origin or classification is uncertain. [11][12]
Illustrative supplier comparison – not actual quotes or tariff rates:
Supplier/origin assumption Product cost Freight and fees Tariff rate Landed cost/unit MOQ Lead time Constraint Current supplier, Origin A $18.00 $2.00 20% $23.60 500 45 days Assumed 2.5% defect rate Candidate supplier, Origin B $19.00 $2.50 5% $22.45 1,000 70 days Quality validation required Candidate supplier, Origin A $17.50 $2.25 20% $23.20 2,000 35 days Supplier concession assumed; capacity unverified
Keep unsigned concessions out of the approved baseline. Compare payment schedules as well as landed costs: longer terms change when cash is due, while larger MOQs tie up more cash and increase excess-stock risk. Factor in expected defects, rework, and expedited freight to find the source that protects gross profit with the least cash and execution risk.
Assess Purchase Timing and Cash Needs
Compare normal, accelerated, and reduced purchasing using the same demand forecast, available inventory, lead time, holding cost, markdown risk, and cash constraints. Report projected gross profit and committed cash, with financing, storage, and markdown costs shown separately.
Choose the timing that protects gross profit with the least cash and execution risk. Accelerating orders only helps when qualifying tariff savings exceed those added costs.
Use the customs entry or withdrawal event, not the purchase order date, to determine tariff timing. If timing is uncertain, show both outcomes. [10][13]
Set Up Tariff Reporting with Retlia
Once you’ve modeled exposure and compared responses, turn that workflow into a repeatable reporting process.
Build a Repeatable Tariff Reporting Process
Start with the categories with the highest exposure. Load tariff, supplier, sales, and inventory data into Retlia’s warehouse for SKU-level margin reporting. Keep transactions in their source systems and schedule reporting updates, using real-time updates where supported.
Use one tariff table with SKU, supplier, origin, HTS code, tariff rate, effective date, and recorded source timestamp to calculate tariff-adjusted profitability. Keep historical rates so you can reproduce estimates for the relevant transaction dates.
Publish exposure dashboards so finance, merchandising, sourcing, and operations can review pricing, sourcing, and purchase scenarios before approval. Teams can then use the same reporting base for approvals and later performance tracking.
Assign Data Owners and Check Reports
Give each team clear responsibility for its data:
- Finance owns margin definitions and cost reconciliation.
- Sourcing owns supplier, origin, purchase price, lead time, minimum order quantity, and payment terms for landed-cost and purchasing decisions.
- Trade compliance validates classifications, rates, exclusions, and effective dates for tariff accuracy.
- A data or operations owner keeps reports reliable by checking connectors, update status, record quality, and exceptions.
Before publishing, confirm the latest update times and reconcile sample SKUs against ERP purchase costs and invoices. Merchandising or channel owners should verify selling prices, promotions, and channel mappings.
Display both the calculation and the source timestamp so users can tell a current estimate from a finalized finance figure. Save each approved scenario separately, along with its assumptions, approver, version, and effective date.
With owners and checks in place, use the same structure to track results after each decision.
Track Profit Results and Reporting Time
After each tariff response, compare projected and actual gross-profit dollars, gross-margin percentage, unit sales, conversion rate, inventory days, supplier cost variance, and cash committed. To measure execution speed, also track report prep time, reconciliation hours, and analyses that need technical support.
These metrics help show whether the workflow improved speed and profitability. Review them alongside demand, tariff accuracy, supplier execution, inventory availability, and pricing decisions to refine the next response.
Contact Retlia to build tariff-adjusted profitability reporting.
FAQs
How can I estimate demand after a tariff-driven price increase?
Compare each SKU’s past sales at different prices with units sold after a price increase. Use that comparison to refine your price elasticity assumptions.
In your data warehouse, track units sold, gross margin changes, and the pass-through rate – the share of cost increases passed to customers rather than absorbed by your business.
Break down the data by brand, category, and customer type to spot price-sensitive products. These products may need smaller pack sizes, substitutes, or sourcing changes – not just higher prices.
How should I model tariffs that are still uncertain?
Use scenario planning in a centralized retail data warehouse to compare potential tariff rates and sourcing changes. Model how each option affects landed costs and gross margins, then weigh lead times and on-time delivery rates before changing how you operate.
Include every cost component – such as freight, duties, and platform fees – and standardize costs by currency and date. Update scenarios regularly with real-time data as conditions change.
How can I start tariff reporting with limited IT support?
Bring your ERP, POS, and supplier data together in a retail-specific data warehouse like Retlia. Automated data pipelines, standardized schemas, and pre-built retail KPI models help you skip custom builds and lengthy implementations.
With drag-and-drop dashboards, non-technical users can model tariff impacts, test pricing scenarios, and track margin erosion in U.S. dollars – without SQL expertise or constant help from IT.
